Circa input file guide
The video walks through the types of files you can plot in Circa, as well as how to export a file from Excel.
Genome file
The first step in Circa is to load a “genome file” with the chromosome names and sizes:
chromosome,size
1,249250621
2,243199373
...
Y,59373566
This information enables Circa to draw the chromosomes with the right names and relative sizes. Human GRCh37 (hg19) and GRCh38 are included with a simple button push. For other genomes, you can generate that genome file in any way you want, but the method below covers a common case.
From FASTA to a “genome file”
If you have a FASTA file, you can use samtools faidx to get the .fai index file, which has the same info as the genome file needed.
# starting with your_genome.fasta, index it to get the lengths
samtools faidx your_genome.fasta

# then add a header:
cat <(echo -e "chromosome\tsize\tnot_needed1\tnot_needed2\tnot_needed3") your_genome.fasta.fai > genome_file_for_Circa.tsv
Here’s a toy example (with very short sequences):
# contents of your_genome.fasta
>A
ATATATATAT
>B
AATCGATGTA
>C
CAGTGTCTGTATAGCCGATA

# contents of genome_file_for_Circa.tsv
chromosome size not_needed1 not_needed2 not_needed3
A 10  3 10  11
B 10  17  10  11
C 20  31  20  21
(These will actually be tab separated; this site just renders the tabs as spaces).
Note the first column has chromosome names and the second column contains the sizes 10, 10, and 20. Then loading that into Circa produces the following base plot:
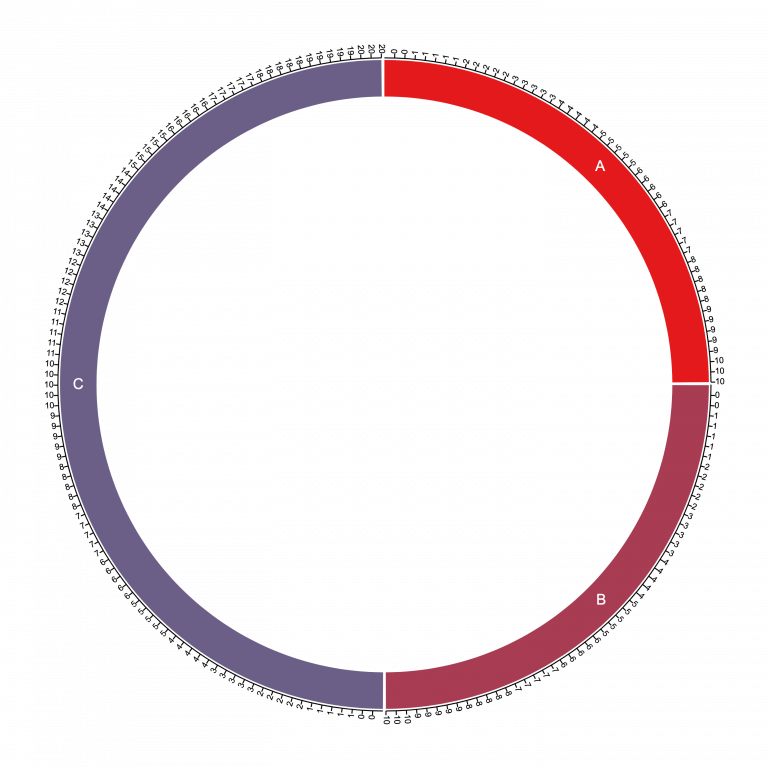
Notice here that the chromosome segments (10, 10, and 20) yield a sum of 40, so the first two chromosomes each take up 10/40 = one quarter of the circle, and chromosome C takes up 20/40 = one half of the circle.
This is the coordinate system that we then start plotting data onto.
Main data files
Now that you have the “genome file”, the coordinate system is all set up and ready for you to start plotting your data. Just remember that the chromosome names must match and the data points will only be plotted if they fit inside the chromosome sizes you indicated in the genome file. A warning will be shown in Circa if any data points are skipped due to this kind of name or size mismatch.
Here is an example:
#chrom,start,stop,name,size,strand,type
1,104480855,104480856,SV1,5269,+,Insertion
1,105255033,105256189,SV2,1156,+,Deletion
1,105255033,105256189,SV3,1156,+,Deletion
This one file can be used to draw various kinds of layer types:
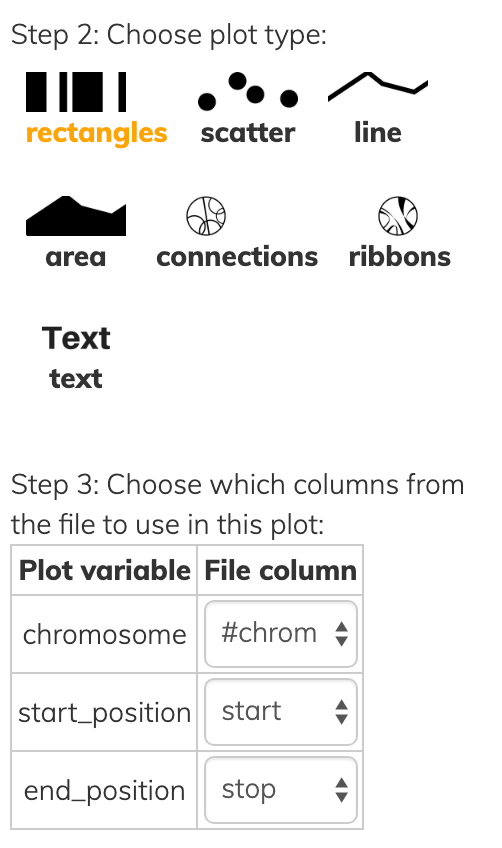
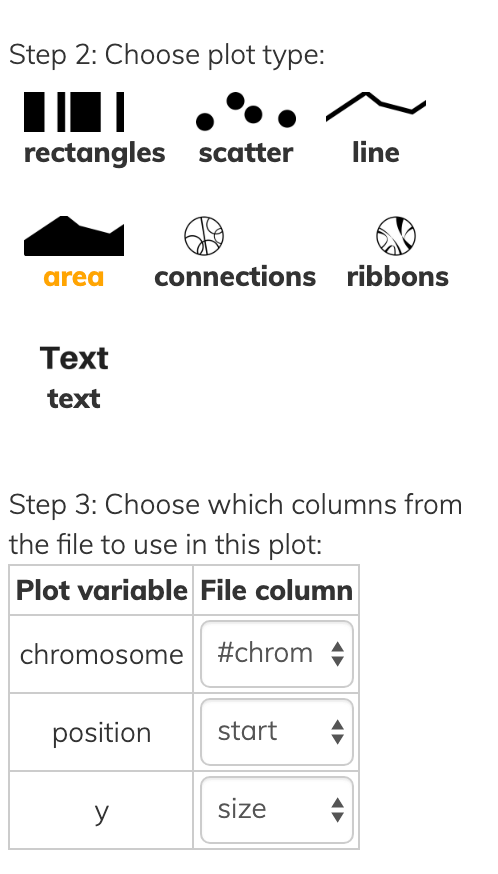
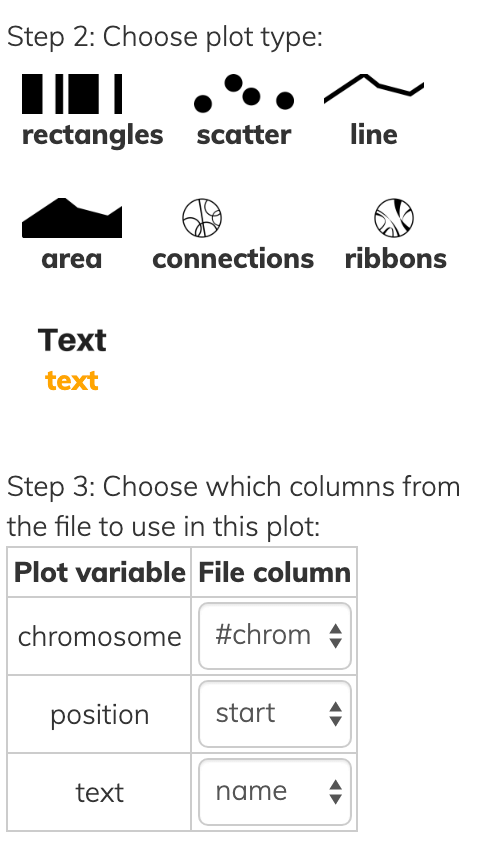
Notice that all layer types have at least a chromosome and one position, while each has some additional information to convey in Step 3 of each screenshot above.
- rectangles have both a
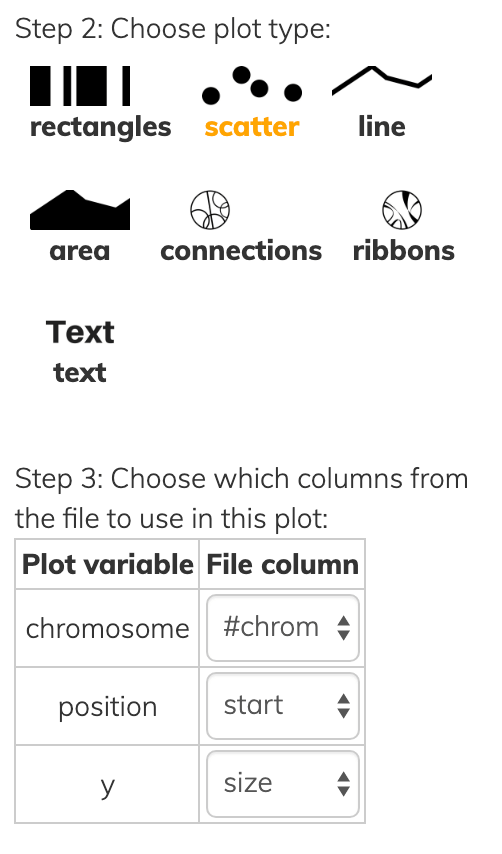
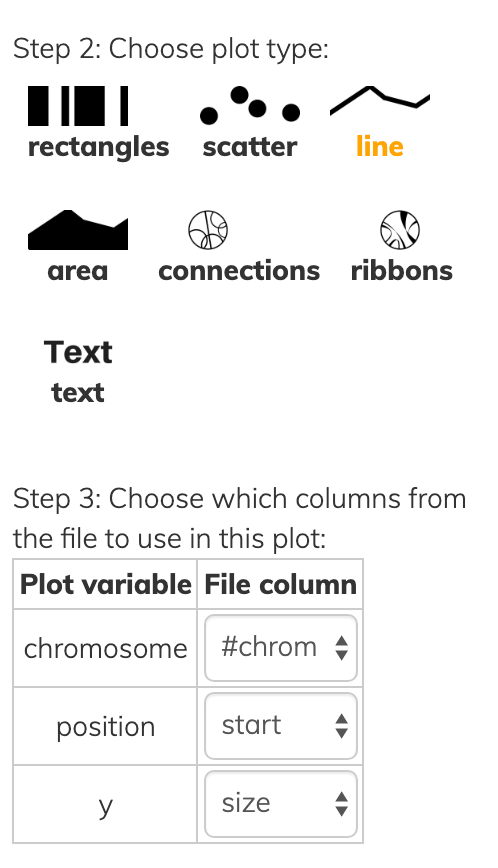
startandendpoint instead of a singleposition. - scatter/line/area data points have a
ysimilar to the y-axis of a cardinal plot except that everything is on radial coordinates, so instead of a high y-value being higher up it’s farther away from the center. - text of course has the actual text to show.
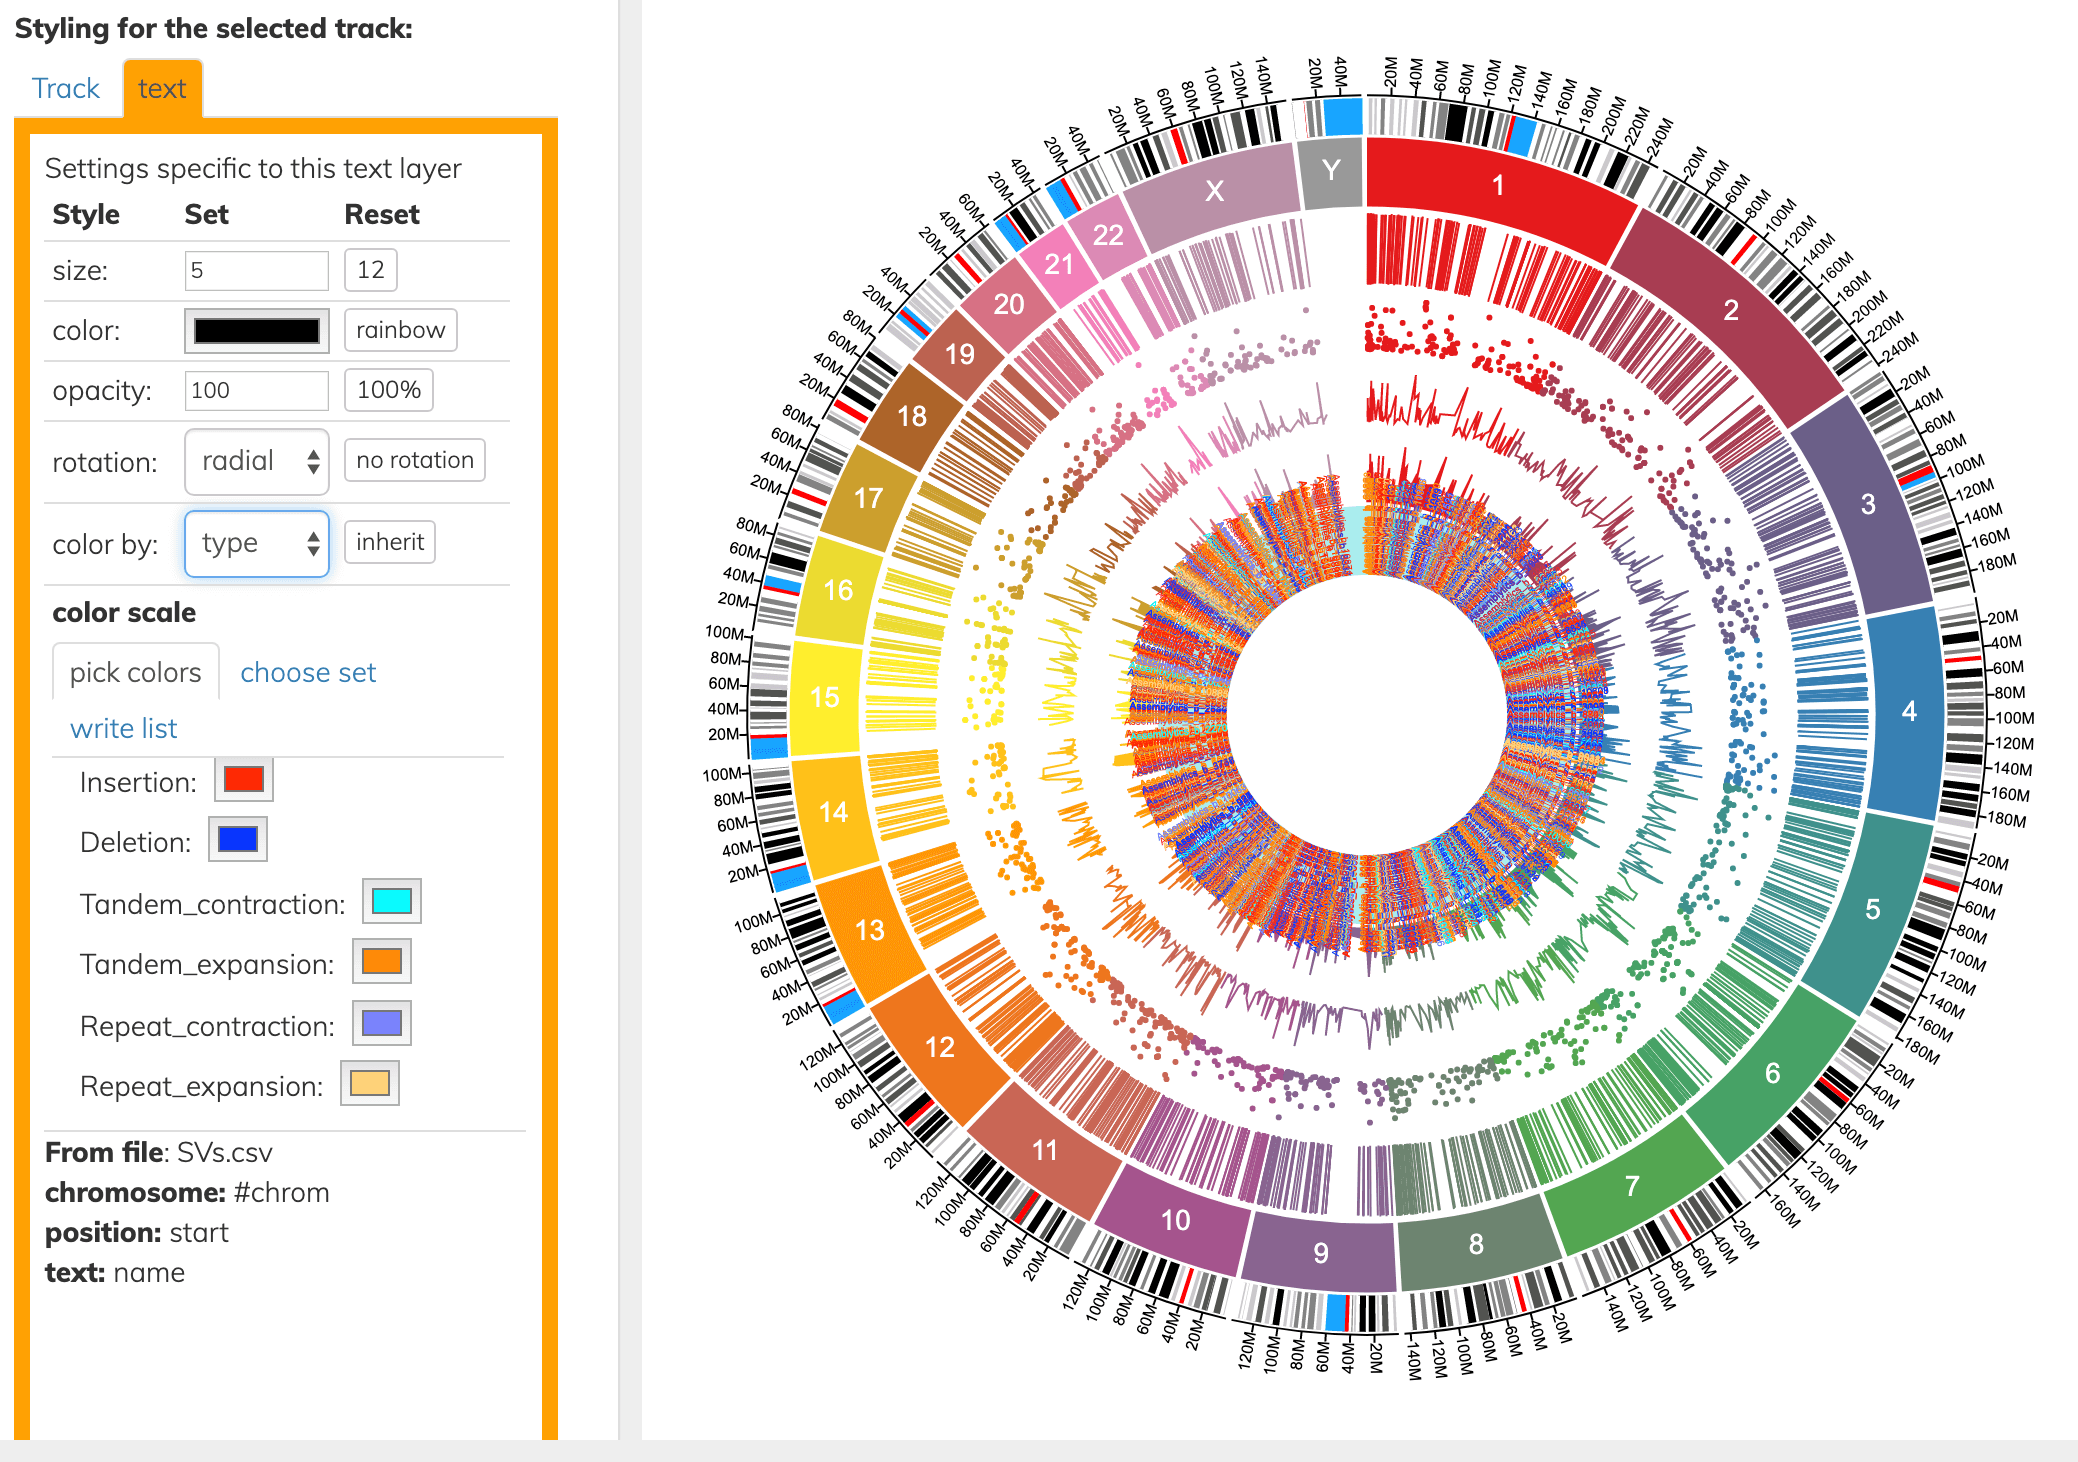
The layer types above can also be colored by a column. Here we color the innermost text layer by the “type” column.
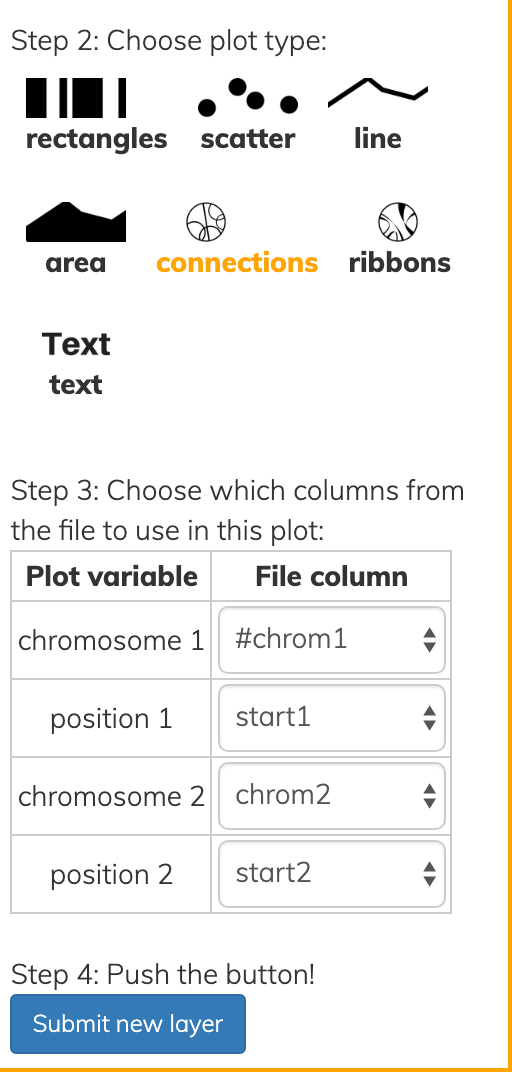
Connecting 2 positions in the genome
To draw connections or ribbons, since these connect two positions in the genome, the file will need to have two pairs of chromosomes and positions:
#chrom1,start1,stop1,chrom2,start2,stop2
1,0,200000000,6,0,100000000
8,0,40000000,X,60000000,2000000
The data file above produces the following ribbons given the settings shown:
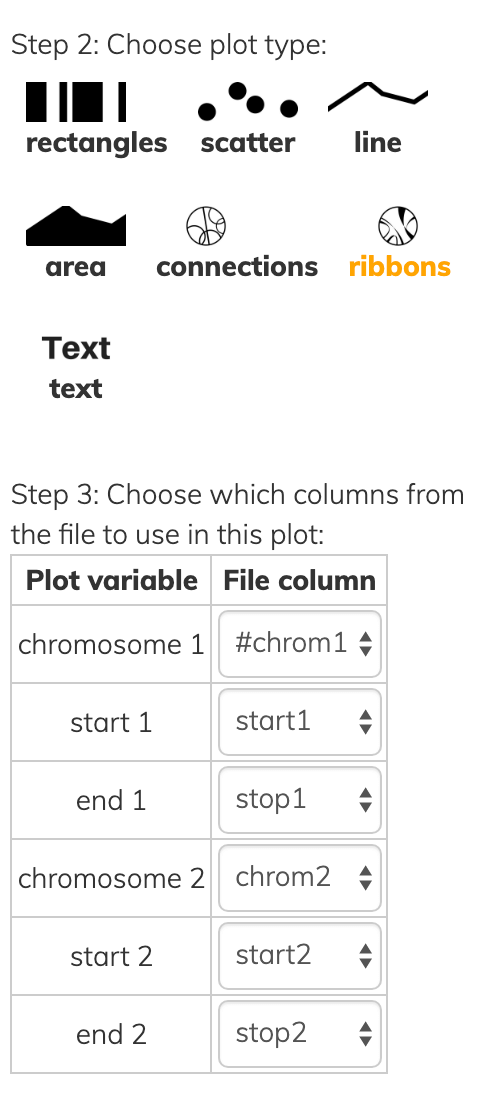
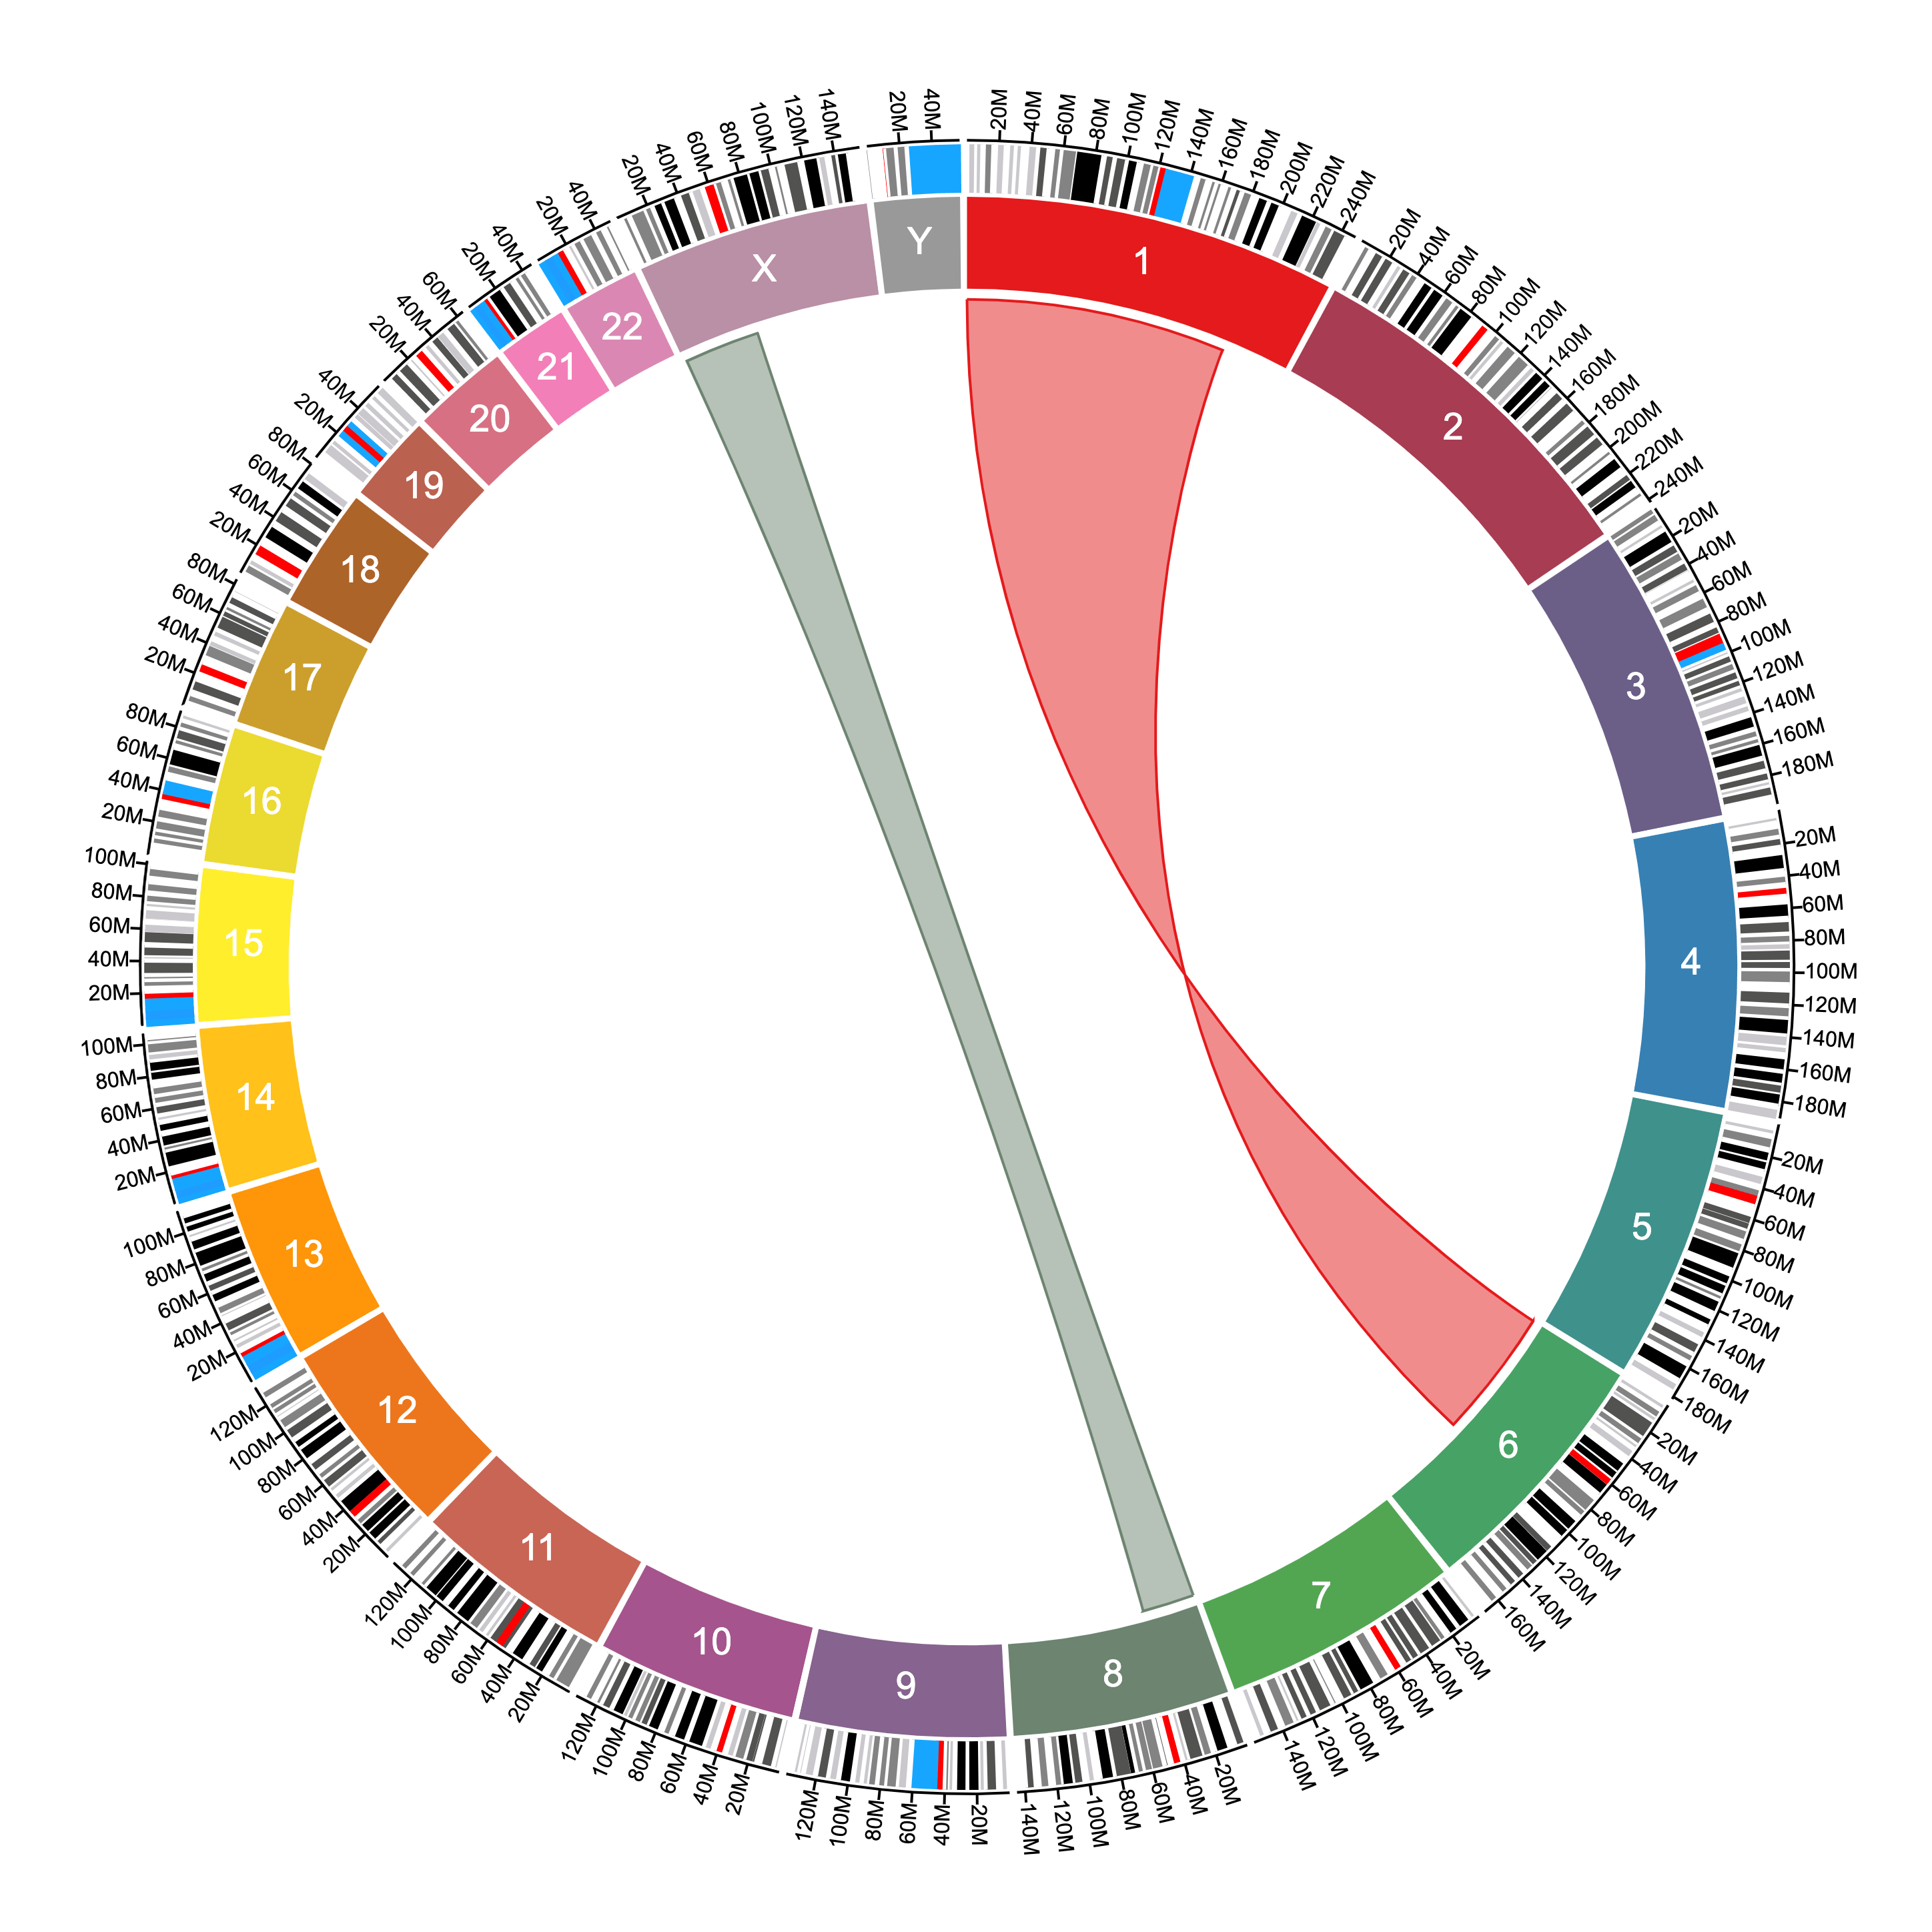
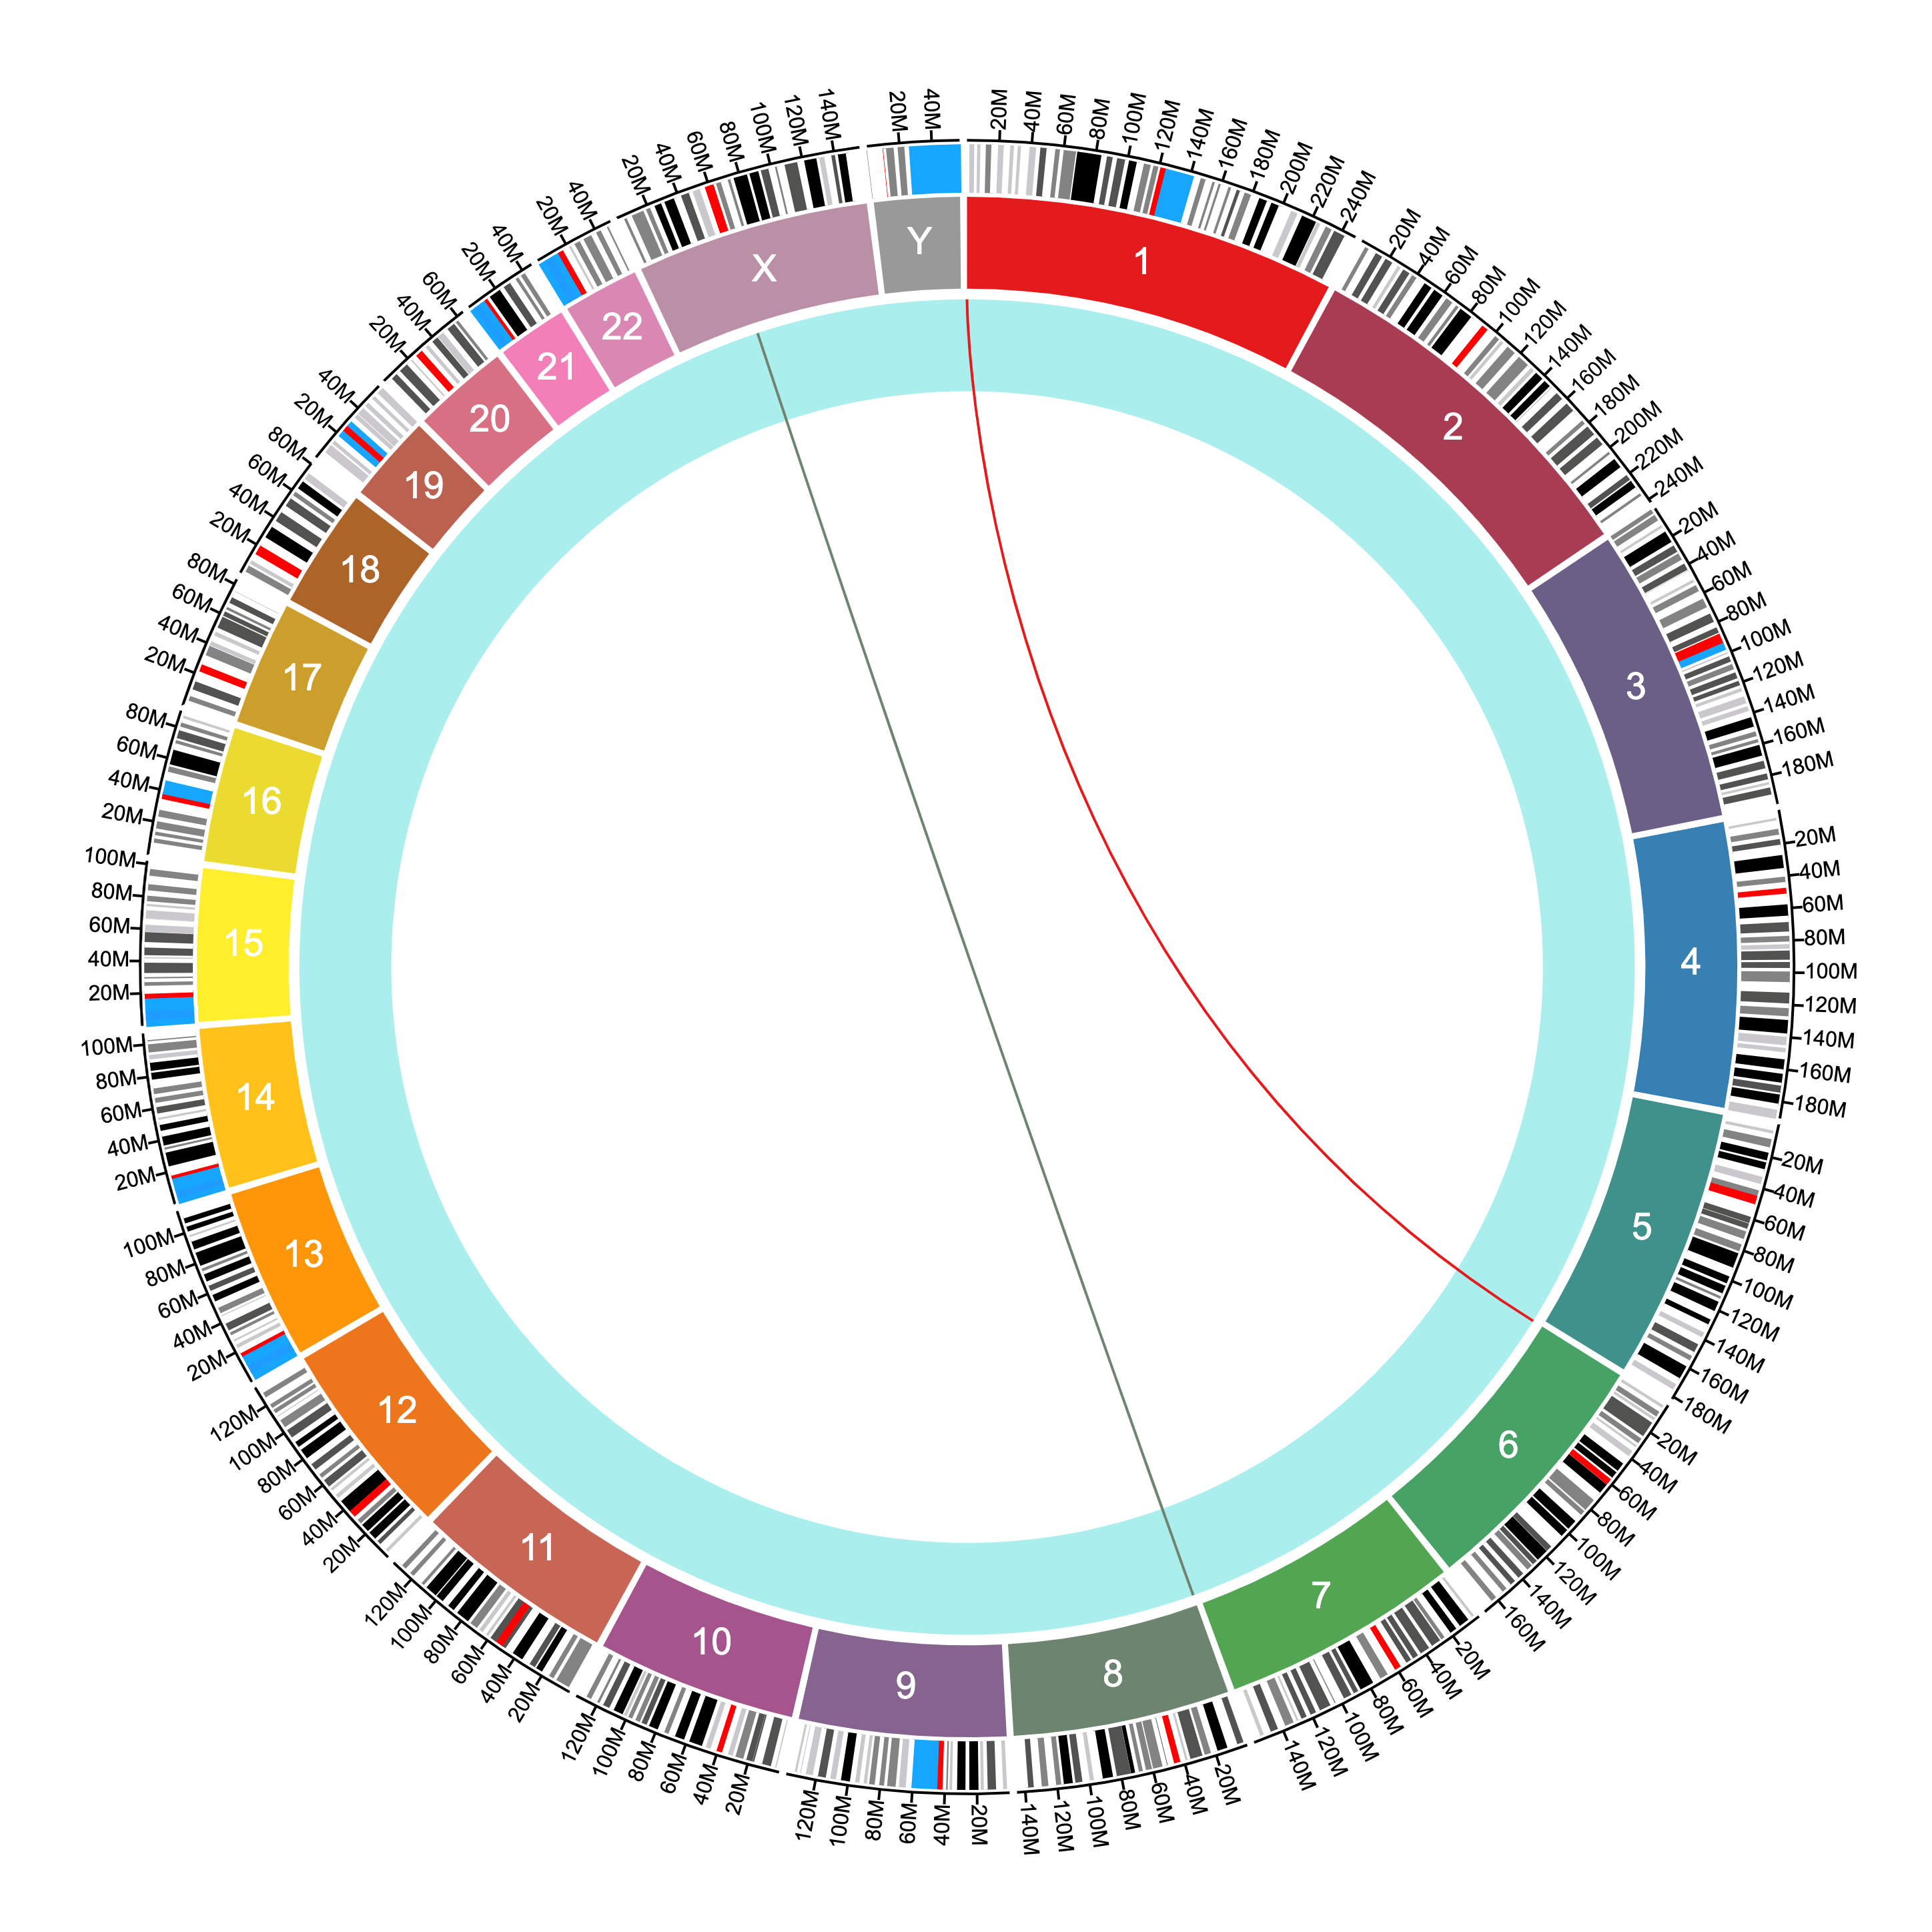
The difference between ribbons and connections is that ribbons use both the start and stop positions to connect two sequences, while connections use only one position to connect two points in the genome.
The same file above produces the following connections given the settings shown:
More notes on file formats
Rows and columns
Each file must be neatly formatted into rows and columns, where columns are separated by tabs, spaces, or commas. The delimiter is detected automatically.
Header
Each file must have a header in the first row, which gives the name for each column. See examples above.
Size
The files must be smaller than 10MB. Anything bigger than that would create a really crowded plot anyway, so it is best to filter your data or consolidate it if the file is too big. This will also better show the information you are trying to convey.
Text files
Circa cannot read binary files or any or formats that are not human-readable in a text editor like nano, vim, or TextEdit. Excel files can be exported to CSV by going to File -> Save As… and changing the File Format in the dropdown to CSV.
What next?
Check out the other tutorials for Circa on the Circa tutorials page.
If you still have a burning question, you can email me at [email protected].
When you have made sure Circa is right for you, you can get it here:
If you are not satisfied with Circa, email me at [email protected] and tell me why you are disappointed to get a full refund.