Circa
Powerful data visualization software for creating circos plots with genomic data
Got 1 minute? See what you can create with Circa
With Circa, you will build a circos plot from your own genomic data in less than an hour.
You probably had to do a fair amount of coding and complex data analysis to get your data to the point where you have results worth visualizing.
With Circa you can take a break from the command-line and create an entire beautiful circos plot without writing a single line of code (also no configuration files).
There are many ways to plot your data in Circa
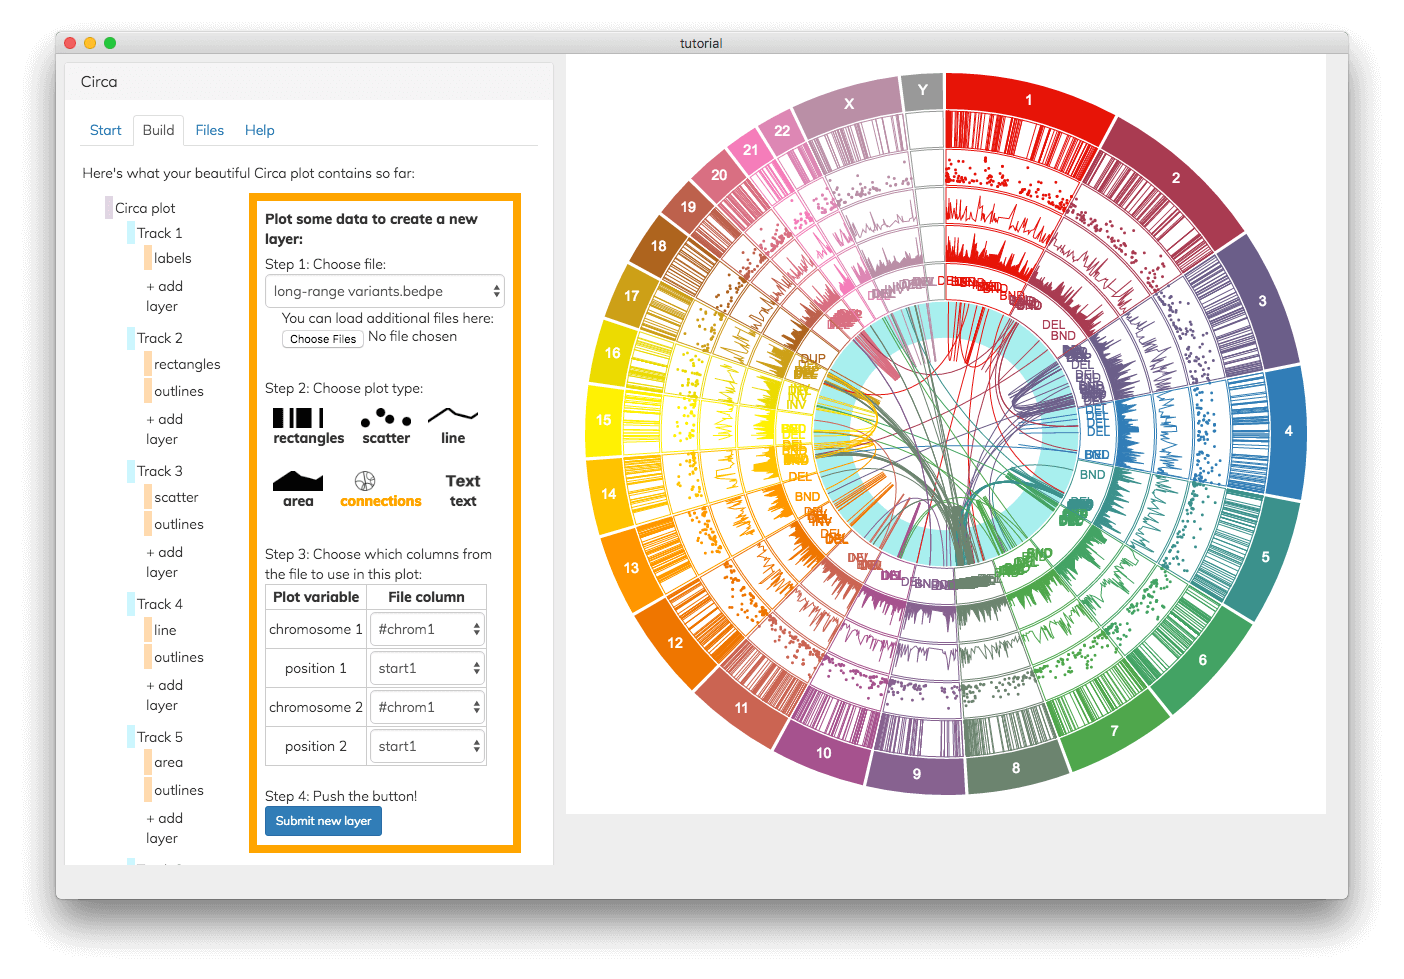
See the input files documentation for explanations of all the plot types and what kinds of data they can be made from.
See your changes immediately, no waiting to re-run a script
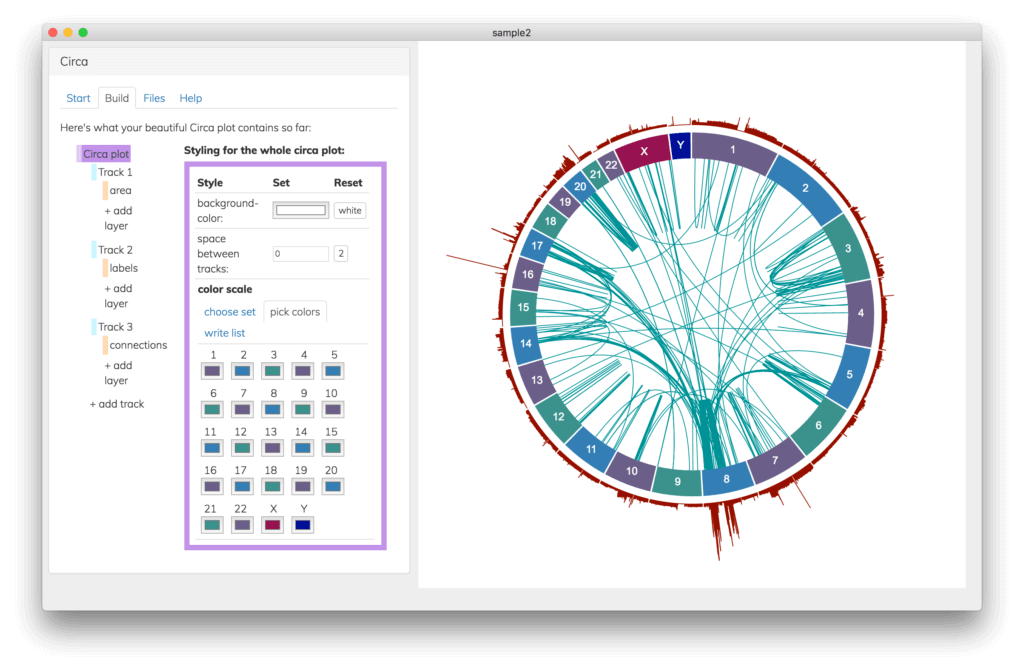
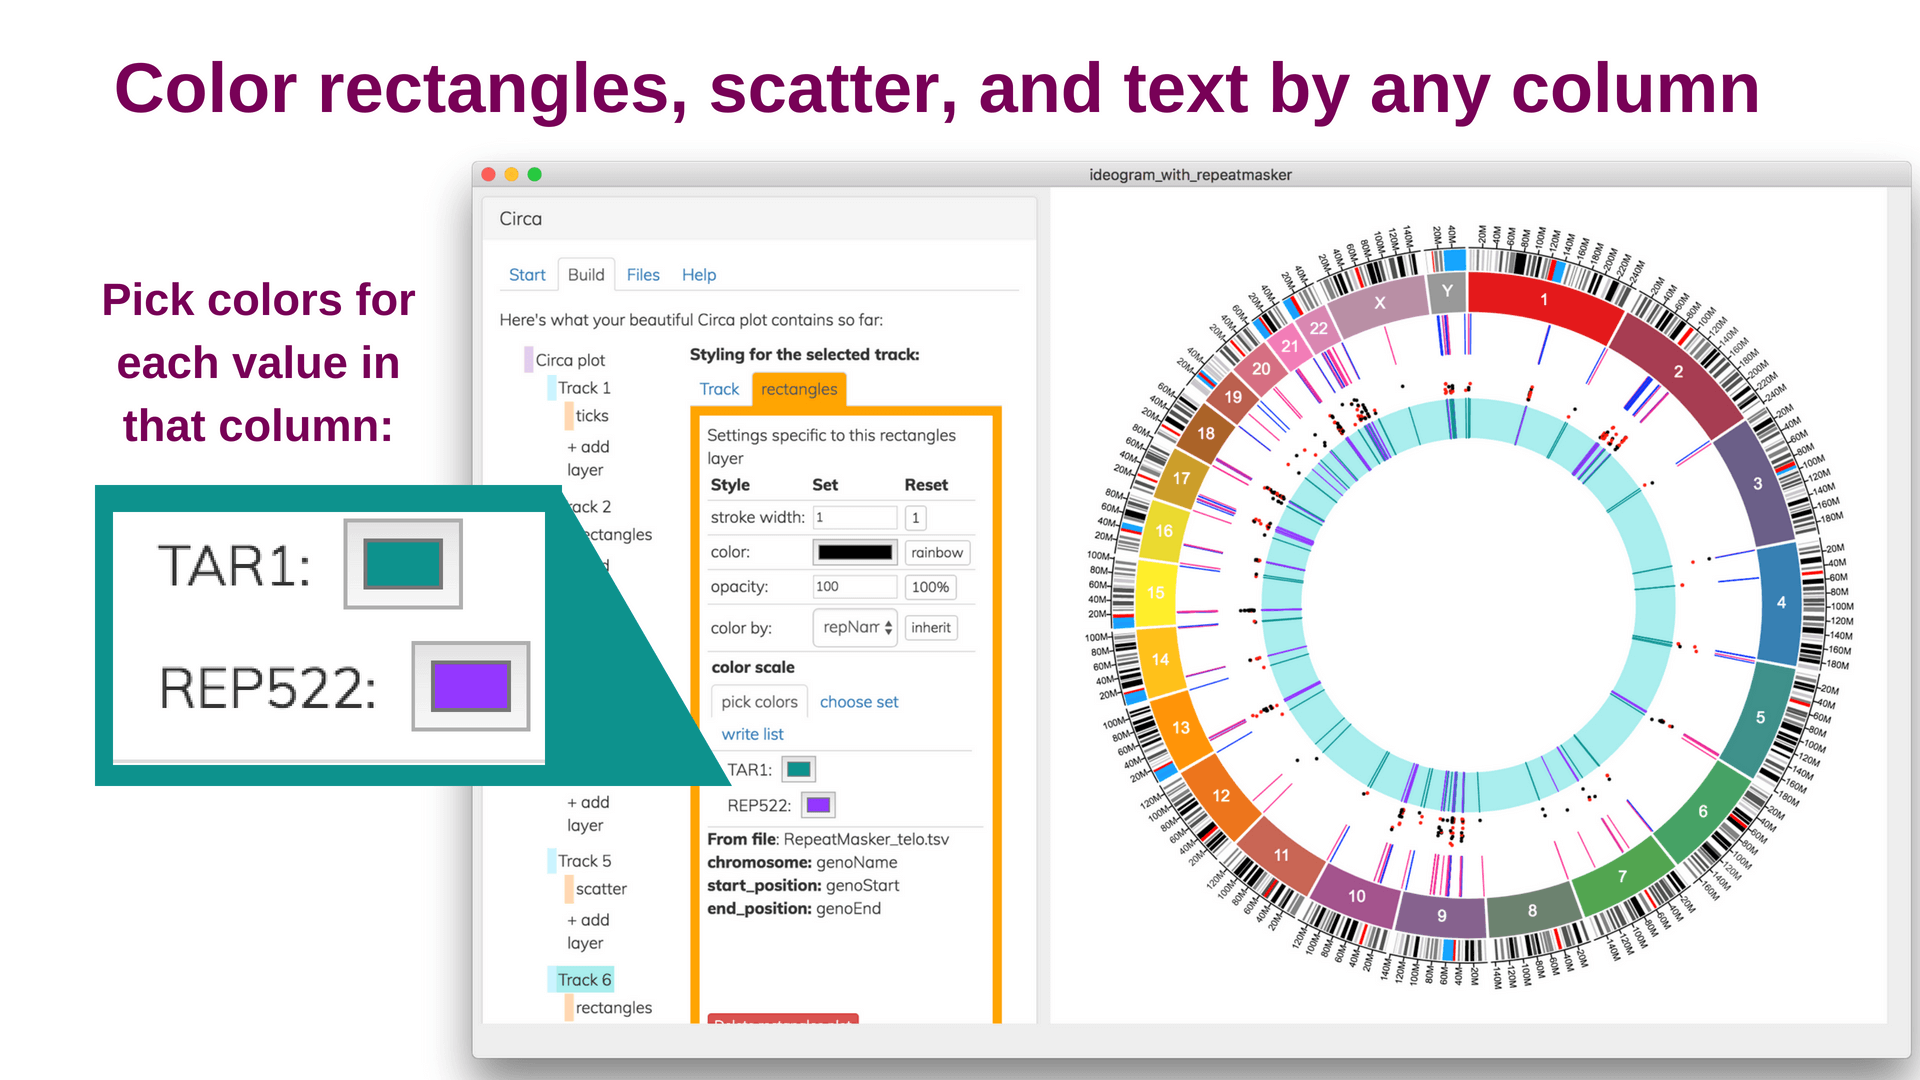
Save and share your Circa plots
You can share circa plots with other people. When you save a plot, it generates a .circa file that includes everything your collaborator needs to see and edit the plot in Circa on their own computer. Just like Word or Photoshop files, if your colleague also has Circa on her computer, she can edit your plot, add data to it, restyle it, and export new images.
Save your publication-quality plot
With Circa, you can save in PNG or SVG format. PNG is a normal image that you can easily use in drafts and presentations, while SVG is completely scalable and has infinite resolution. The SVG plot you get from Circa can also be edited in Adobe Illustrator or Inkscape, where you can also save it as a PDF.
Very happy with my purchase of Circa by #OmGenomics and @marianattestad. Only 20 minutes in & I already have a publication-ready plot!
Who is Circa not for?
Circa is not for you if:
- If you don’t know what your reference genome is and where your data points go on that reference genome
- If you haven’t figured out the bioinformatics analysis yet — Circa only does the plotting, not the analysis, so for example, FASTQ, FASTA, and BAM files need some work before they become data points you can plot.
- If you can’t make CSV or TSV files from your data — Circa needs these (or a VCF less than 10 MB) where each line is a data point.
- If your data points don’t have chromosomes and basepair positions attached to them — Circa needs to know this about every data point so it can plot them onto the genome’s coordinates.
Tutorial videos
What do you get?
When you buy Circa, you will get immediate access to download Circa for Mac, Windows, and Linux operating systems. You will also get a Starter Pack of example input files to experiment with.
Ready?
First check the input data guide to make sure your data works with Circa.
If you still have a burning question, you can email me at [email protected].
